- Research
- Open access
- Published:
Design and validation of a deep evolutionary time visual instrument (DET-Vis)
Evolution: Education and Outreach volume 15, Article number: 12 (2022)
Abstract
Understanding deep evolutionary time is crucial for biology education and for conceptualizing evolutionary history. Although such knowledge might help citizens contemplate their actions in the context of human existence, understanding deep evolutionary time is a demanding cognitive endeavor for students. The enormous magnitudes of evolutionary time are often visually communicated through phylograms and timelines. Given the importance of understanding evolutionary time in various scientific domains at large, there is a need for tools to gauge students’ knowledge about visually communicated deep evolutionary time. In response, we describe the design and validation of an instrument to measure knowledge about the visual representation of deep evolutionary time. Development, expert panel evaluation, and piloting of an initial 14 questions with 139 respondents resulted in a 10-item multiple-choice questionnaire. Subsequent collection and analysis of 212 responses validated the 10-item Deep Evolutionary Time Visual Instrument (DET-Vis). Identification of a single factor suggests a unidimensional construct that represents knowledge about the visual communication of deep evolutionary time. A Cronbach’s alpha of 0.73 yielded an acceptable internal consistency of the instrument. The items of the instrument discriminate well with discrimination coefficients between 0.25 and 0.53. The instrument is of moderate difficulty with difficulty indices ranging from 0.56 to 0.81. The seven-step methodological design and validation procedure of this study yielded a unidimensional, valid, and reliable ten-item deep evolutionary time visual test instrument. The instrument items probe both procedural and declarative aspects of the construct that could warrant future psychometric exploration. Use of DET-Vis in pedagogical practice could help support the teaching of deep evolutionary time at upper secondary and undergraduate levels.
Introduction
All living organisms are the result of evolution occurring over immense time spans but prior research has shown that understanding evolution is challenging for students (e.g., Smith 2010). One reason for this is that evolutionary processes operate on temporal scales ranging from hours to millions of years depending on the evolutionary context; be it changes in allele frequencies in a population (microevolution) or diversification of higher taxa (macroevolution). Therefore, understanding evolution necessitates conceptualizing evolutionary processes occurring in short time spans (e.g., antibiotic resistance in bacteria) as well as in deep evolutionary time scales (e.g., diversification of life).
Although the resources that enable modern human civilization are drawn from the deep past, upper secondary and undergraduate university students’ knowledge about evolutionary time scales is limited (e.g., Catley and Novick 2009, 1998; Trend 2001b). One reason for this dearth in knowledge is that time is difficult to conceptualize. While the passage of time might be perceived as a concrete phenomenon in an everyday sense, understanding time remains elusive and difficult to define (Buonomano 2017). Even more challenging is grasping the notion of deep evolutionary time (DET), time emanating from the origin of life about 3700 million years ago (Pearce et al. 2018). Even though the lineage of hominins leading towards our own species traces back seven million years (Stenlund and Tibell 2019; Wood 2010) this is still an extremely brief timespan in the context of the history of life. Another reason for the lack of knowledge about DET, illuminated by Estrup and Achiam (2019) is that epistemological aspects of time are often neglected in science education where deductive experimental sciences dominate, in comparison with inductive historical sciences such as paleontology and paleobiology. Furthermore, prior research (e.g., Cobern 1996; Hansson and Redfors 2006) shows that apprehending the vastness of DET requires more than mere comprehension or “knowing”. It might also require a shift in one’s worldview which involves the complexity of negotiating other aspects such as self-identity and contradictory convictions.
Knowledge about timescales comprising billions of years such as DET is crucial in several sciences, not least in biology where it provides the historical context for the existence of humans and other organisms. Moreover, time is a major factor in combination with other aspects such as population sizes and mutation probabilities in the complexity of evolutionary processes occurring over many generations (Carroll 2006; Hoekstra et al. 2005). Knowledge about DET also provides valuable information in decision making and actions that have consequences for the (deep) future. Indeed, the following contemporary issues are related both with the past and future (Bjornerud 2018; Irvine 2014). Not only are humans rapidly consuming resources that have gradually accumulated during the deep past, but also impacting the future with human-induced climate change through sudden (from a DET point of view) emission of carbon dioxide (Johansson and Stenlund 2022) and swiftly diminishing biological diversity (Barnosky et al. 2011; Ceballos et al. 2015). Despite the short existence of our species in relation to the context of macroevolution, the impact of humans on planet earth has reached a magnitude which, once a marker has been decided, will demarcate of a new geological epoch—the Anthropocene (Subramanian 2019).
As eloquently articulated by Lee et al. (2011), time-related concepts are part of every imaginable scientific phenomenon. Therefore, science education is most important in providing necessary knowledge to incorporate vast time spans and to convey events and processes intertwined with DET. A frequent way of communicating DET in the historical sciences is through visual representations. In biology education, DET is often visualized by depicting how relatedness has evolved in phylogenetic diagrams while other representations illuminate temporal distribution, which are sometimes complemented with indications of abundance. Due to the importance of interpreting and understanding DET through communicated visual forms, there is a need to investigate how visual representations are conceptualized by students. Visual representations are essential for communicating multiple perspectives of deep time. For example, much research has explored students’ understanding of phylogenetic trees (Blacquiere et al. 2020; Blacquiere and Hoese 2016; Dees and Momsen 2016; Thanukos 2010), a paramount form of visual representation related to evolutionary time. Despite these contributions, to our knowledge, no diagnostic tests have yet been specifically developed to assess students’ knowledge of the visual communication of DET. The current journal has given important attention to developing valid ways to measure and assess evolution understanding, as represented by a recent special issue (Nehm and Mead 2019) and accompanying multiple validated instruments. However, there is yet no instrument that specifically targets measuring knowledge about the visual communication of time in evolution. Considering the centrality of the temporal dimension in evolution, it is urgent to measure understanding of visually conveyed DET. Therefore, our objective in this study is to develop an instrument to evaluate upper secondary and undergraduate university students’ knowledge about the visual communication of deep evolutionary time.
Theoretical background
Investigating and diagnosing students’ understanding of deep evolutionary time
Developing and validating measurement tools such as concept inventories can help diagnose key evolutionary concepts and ideas that are challenging for students. Furrow and Hsu (2019) describe that such tools are useful for informing evolution learning objectives of a course, diagnosing key misconceptions, measuring students’ knowledge, assessing learning, and informing future teaching practice around evolution.
Cheek (2010) points out that subject matter knowledge plays a key role in judging and categorizing novel information. Learning about events and processes in deep evolutionary time are much affected by prior knowledge. Therefore, understanding macroevolution is intertwined with understanding DET. Existing understanding provides a foundation upon which temporal aspects can be mapped and enable novices to discriminate common surface features in favor of more meaningful features, such as analyzing relationships based on the most recent common ancestor rather than spatial proximity in a tree diagram. Subject matter knowledge about macroevolution also provides a conceptual basis which can be related to events and processes in other disciplines such as geology (e.g., plate tectonics) and astronomy (e.g., the formation of planetary systems). Also, in relation to issues regarding sustainability, knowledge about macroevolution can enable students to compare the time span for the formation of coal from biological decay with the rate of industrial consumption of coal during the last hundred years (Johansson and Stenlund 2022).
In terms of key evolutionary ideas, Lee et al. (2011) assert that the ability to interpret the temporal order and duration of events in geology, cosmology, and biological evolution is an important aspect of science education. Previous research on the design of instruments has primarily focused on deep time in a geoscientific sense which exceeds DET by approximately 1 billion years prior to the origin of life (i.e., about 3.5–3.8 bya). The appearance of a selection of these initiatives in the literature are described chronologically as follows.
In a series of studies using a variety of instruments, Trend (1998, 2000, 2001a, b) investigated understanding of geological time among 10 and 11-year-old children, primary teacher trainees, primary teachers and 17-year-old students. While Trend revealed that the participants grasped relative time more securely than absolute time (Trend 2000), they had a very coarse-grained appreciation of events in Earth’s deep past. According to Trend, participants' views tended to fall into a few categories, for example, “extremely ancient”, “less ancient” and “geologically recent” (Trend 2000, 2001a). A few years later, Nadelson and Southerland (2009) presented a concept inventory, “the Measure of Understanding of Macroevolution” (MUM) which contained items regarding deep time. Changes to MUM were later suggested by Novick and Catley (2012). Items related to deep time in these studies showed both higher and lower mean item difficulties compared to items related to classification, speciation, nature of science and fossils, which indicates a partial and incomplete knowledge about deep time. It should also be noted that understanding evolutionary processes does not always require understanding of DET. For example, the CINS instrument developed by Anderson et al. (2002) is largely focused on microevolution.
Dodick and Orion (2003a) developed and used the Geological Time Aptitude test to evaluate junior and senior high school students’ ability to recreate and represent the transformation of a series of geological structures over time. The authors later complemented this test with two other instruments, namely the Temporal Spatial Test, which tests the ability to relate spatial and temporal thinking, and the Strategic Factors Test that measures how influential dimensional factors are on temporal awareness (Dodick and Orion 2003b). During the early 2000s Hidalgo et al. (2004) investigated how high school and technical school students answered questions regarding the concept of geological time that demanded knowledge and skills about temporal location, temporal arrangement, and processing time intervals. The findings revealed that the students lacked knowledge in locating relevant geobiological events. In addition, based on the students’ difficulties, the authors illuminated the importance of having an appropriate representation of geological time intervals in understanding geologic changes. These results are in accordance with a study by Catley and Novick (2009) who examined university students’ knowledge of deep time by probing seven significant historical and evolutionary events. Their research showed that many students lacked a cognitive foundation to make sense of deep evolutionary time. In another study, Lee et al. (2011) developed a 30-item test instrument to investigate university students’ appreciation of even longer time periods extending back to cosmological deep time (i.e., 13.8 bya). Their work revealed that it is possible to measure students’ ability to recognize temporal magnitudes with the instrument and that knowledge, rather than estimation, of the temporal magnitude formed the basis of the measured construct. In a recent study by Colantonio et al. (2021), high school students’ conceptual understanding of cosmological time based on an open-ended questionnaire revealed that students’ knowledge about the age of the universe was rather limited.
Understanding the visual communication of deep evolutionary time
Visual representations are pivotal for communicating DET in disciplinary contexts. The knowledge required for interpreting such visuals contains aspects of declarative knowledge (knowing-that, e.g., the root of a phylogenetic tree represents the common ancestor to all of the represented species) and procedural knowledge (knowing-how, e.g., to deduce the relatedness of various organisms over time). When it comes to memory structures in the visual system, ten Berge and van Hezewijk (1999) assert that declarative knowledge is intertwined with procedural knowledge. Their stance termed procedural vision, describes the idea that declarative knowledge often emanates from procedural knowledge. This assertion is evidenced in observations that children learn procedures prior to learning facts. The authors go on to argue that declarative memory structures are essentially part of procedural memory structures, with declarative knowledge a “special case” of procedural knowledge. It follows that in visual processing and memory systems, both declarative and procedural knowledge are part of the “outcome”.
Successfully understanding visually communicated DET requires the interpreter to know how, and to know what, to interpret in the representation. More specifically, the interpreter is required to engage a degree of procedural knowledge in knowing how to, for example, map between two phylograms to deduce whether they communicate the same relationships. At the same time, the interpreter is also required to engage a degree of declarative knowledge in knowing that the most recent common ancestor is represented by the node where two lineages intersect.
In biology learning contexts, Odom and Kelly (2001) have suggested that fostering relationships between the acquisition of declarative knowledge through the use of procedural knowledge can promote biology learning. In addition, Schönborn and Bögeholz (2009) have proposed a taxonomy that identifies the combination of declarative components (biological concepts, principles and fundamentals) and procedural components (ability to translate across and between different visual representations) as being necessary for biology learning. Several studies have explored challenges in students’ interpretation and understanding of visual representations that impart imperceptible temporal magnitudes and their relative differences, including aspects of DET in biology. For example, Stenlund and Tibell (2019) and Stenlund et al. (2021) have conducted studies with a particular focus on temporal aspects in visualizations comprising DET. They described various challenges in appreciating facets of time including the ability to locate particular points in time, appreciate order of events, approximate a time interval duration, compare various timespans, and recognize the simultaneous occurrence of events. In other work, Meir et al. (2007) uncovered several temporal misinterpretations in phylogenetic trees, including misreading the time axis by interpreting the passage of time in a horizontal instead of a vertical direction, or the erroneous interpretation that the uppermost left species was the common ancestor of all the other represented species. Gregory (2008) also found that a common misinterpretation is that two contemporary species have evolved for different durations of time since their most recent common ancestor. Finally, Stenlund et al. (2021) showed that a frequent misinterpretation among upper secondary students was perceiving multiple intervening nodes along a lineage as signifying more elapsed time.
Among the visualizations used in biology education, tree of life representations are of central importance (Catley and Novick 2008; Schramm et al. 2021) since they reflect several paramount aspects of biology such as biological diversity, common descent, deep evolutionary time and biological relationships. It follows that understanding macroevolutionary concepts relies on interconnecting tree thinking with DET (e.g., Novick and Catley 2012). Work by Halverson and Friedrichsen (2013) has shown that interpreting tree of life visuals requires specialized representational competence for reading tree diagrams. Such competencies include knowledge about the phylogenetic representation and an ability to recognize the visual information making up the representation. Temporal aspects are always included in tree diagrams since the definition of a relationship is based on the most recent common ancestor (Baum et al. 2005). Specifically, DET is usually communicated through various forms of visualizations (Stenlund 2019), of which some commonly used examples are presented in Fig. 1. Visual forms include phylograms (Fig. 1a), timelines (Fig. 1b), and other representations such as spindle diagrams (Fig. 1c) and bar-graph type images (Fig. 1d). Other visual forms are timeline analogues such as spirals, and “bootstrapping” images that help bridge large differences in temporal magnitudes. Metaphors are sometimes used to concretize highly abstract time frames and make them more relatable. Another way to combine very different magnitudes of temporal scales is to compress and expand different parts of a timeline, as shown in Fig. 1b.

Examples of visual representations used to communicate deep evolutionary time in the form of a phylograms, b timelines, c spindle diagrams and d variants of bar charts. (Images: Jörgen Stenlund (a, d) and adapted from the public domain (b, c))
The importance of developing and validating instruments to measure learning supported by visualizations of deep time phenomena was reiterated by Libarkin and Brick (2002). Oliveira and Cook (2017) have also asserted that the visual aspects of learning evolution are often neglected by science educators, and argue for more research on how visual features impact students’ visual perception of evolution. Overall, our synthesis of the literature reveals that there is no diagnostic instrument for evaluating knowledge about the visual communication of deep evolutionary time.
Aim of the study
Given the importance of conceptualizing time in understanding evolution, our specific objective with the study is to develop and validate an instrument to measure upper secondary and undergraduate university students’ knowledge in relation to interpreting and understanding the visual communication of deep evolutionary time.
Methods
The development and validation of diagnostic psychological and educational instruments often follows a systematic sequential process consisting of several phases (e.g., Adams and Wieman 2010; Benson and Clark 1982; Conceição et al. 2007). In this study, the overall development and validation of the instrument comprised seven methodological steps illustrated in Fig. 2 (steps 1–7).

Flowchart outlining the seven methodological steps (1–7) followed in developing and validating the deep evolutionary time visual instrument (DET-Vis)
Instrument development
In this section the seven steps in Fig. 2 (1–7) are detailed. We first formulated the aim of the test instrument and identified the target group as upper secondary and undergraduate university students (1). This was followed by a literature review to describe fundamental aspects of the knowledge required to understand and interpret visually communicated information in relation to DET (2). These fundamental aspects included subject matter knowledge (e.g., Cheek 2010), reasoning about relative temporal magnitudes (Cheek et al. 2017; Lee et al. 2011), interpreting visual inscriptions embedding DET (e.g., Gregory 2008; Matuk 2007), and using visual representations as a tool to reason about DET (Halverson and Friedrichsen 2013). Informed by step (1) and (2), we then developed visual items based on declarative and procedural aspects of visual tasks (3), where the visual forms were synonymous with those often used (cf. Figure 1). A total of 17 items were formulated, where 8 items were stipulated as mainly declarative and 9 items as mainly procedural. In this third step the content, syntax and readability of the items were refined and adapted to an online format (Adams and Wieman 2010) in the form of multiple-choice questions with four response options. Analysis of the readability of the test was performed using the Flesch–Kincaid formula.
In the subsequent step 4, content validation was performed by inviting experienced specialists to provide feedback on the content and readability of the items. Given the aim of the instrument, we sent out the items to a group of 20 individuals that included upper secondary teachers, university teacher educators, an educational psychologist, subject matter experts and science education researchers, wherein we received 11 completed validations.
Each specialist evaluated a subset of the items so that each item was assessed by at least five experts. The experts evaluated the content of each item in response to three questions (Rubio et al. 2003), namely, (i) Please rate the clarity of the item, (ii) Please rate how well the item represents knowledge and/or reasoning required for understanding evolutionary deep time, and (iii) Please provide any comments you might have concerning this test item. In addition to the content validation, the understandability of the items was verified from a general readability point of view. We approached eight persons with varying age and educational backgrounds. Three volunteers (a photographer, a preservice teacher and a study counselor) without necessarily any specialized knowledge about DET provided individual think-aloud feedback about the items while responding to the pilot test instrument.
During step 5, the responses received from specialists and novices formed the basis for a selection, revision, and refinement of 14 items for the pilot test instrument. We invited Swedish university undergraduate students enrolled in either teacher education or a bridging course to participate in the survey. A factor analysis of the pilot data was then performed (6) where the best performing items, based on their factor loadings and recommendations for online surveys (Adams and Wieman 2010), were selected, resulting in a final collection of ten items. In the final step (7) the 10-item test instrument was disseminated among Swedish upper secondary students enrolled in various study programs at several schools, and university students in four different teacher education programs ranging from preschool to upper secondary level at a Swedish university. The responses were used to validate the instrument through factor and psychometric analysis. Each item was formulated as a single-choice, four-option multiple choice question with an accompanying visual representation. The final 10-item instrument, together with the solution key, is presented in the Appendix.
Instrument validation
Recruitment of participants in the validation step aimed for a sample of at least 200 persons, which we judged to be a suitable target given the number of test items, online format (e.g., Adams and Wieman 2010), and recommendations outlined in the literature (Tabachnick et al. 2019). For example, according to simulation findings by Pearson and Mundform (2010), a sample of at least 85 persons could suffice to accurately reproduce a population solution with two factors given high levels of communalities. Thus, while the data characteristics were not known beforehand and larger samples are generally considered better, the targeted sample size was deemed to be a reasonable compromise. The 10-item DET-Vis instrument was administered as an online electronic questionnaire employing Microsoft Forms. In addition to the DET-Vis instrument, background data were collected about respondents’ age, gender, and interest in and prior knowledge about evolutionary history. Participants’ interest in evolutionary history was probed with a 4-option question “How interested are you in evolutionary history?”, with the options ranging from “very uninterested” to “very interested”. Knowledge about evolutionary history was self-assessed with the item “On a scale from 1 (very low) to 7 (very high), rate your overall knowledge about evolutionary history”. Data was collected for a period of two months and participation was anonymous. All participants were informed about the aim of the study, and data was collected and treated in line with Swedish ethical guidelines as well as GDPR stipulations. Each participant was asked to tick a box in agreement to participate in responding to the questionnaire, thus providing their informed consent to contribute to the research study.
A total of 212 (73 male, 132 female and 7 other) participants responded to the questionnaire during step 7 (Fig. 3). Respondents’ ages ranged from 15–55 with a mean age of 22.6 years as shown in Fig. 3.

Age distribution of respondents (n = 212) to the deep evolutionary time test instrument
The proportion and distribution of the participants’ interest ratings is reported in Fig. 4 (top diagram). Participants’ self-rated knowledge about evolutionary history is depicted in Fig. 4 (bottom diagram) and yielded a median value of 4, where 172 (81%) of the students perceived their level of knowledge as intermediate (i.e., between 3 and 5 on the self-rating scale).

Proportion of respondents’ (n = 212) expressed interest (1 = very uninterested, 2 = uninterested, 3 = interested and 4 = very interested), and self-rated knowledge (1 = very low knowledge to 7 = very high knowledge) about evolutionary history. The vertical line represents the midpoint of the interest and self-rated knowledge scales across both ratings
Responses to the 10-item instrument were scored by assigning a value of 1 for correct responses to an item and a value of 0 for incorrect responses, respectively. The possible range of an individual’s total score on the test was between 0 and 10.
We validated the test instrument by using exploratory factor analysis to investigate any underlying latent factors in the collected data. A Kaiser–Meyer–Olkin measure of sampling adequacy above 0.6 (KMO = 0.755) indicated that the data is suitable for factor analysis (Tabachnick et al. 2019). This was further supported by a significant result on Bartlett’s test of sphericity (p < 0.0005) and observing multiple inter-item correlations exceeding 0.30 (Field, 2018). The average inter-item correlation was 0.36, which implies a favorable tradeoff between broad range and consistency among items (Briggs and Cheek 1986). Tetrachoric correlation coefficients were used since the data was dichotomous (Field 2018) and factors were extracted using principal component analysis of the correlation matrix.
The psychometric properties of the resulting 10-item test instrument was characterized in terms of item difficulty index (the fraction of students who answered the item correctly), discrimination coefficient (i.e., corrected item-total correlations) and reliability (Cronbach’s alpha overall and if item deleted). The analyses were performed using SPSS version 27, apart from calculation of the tetrachoric correlation matrix, which was performed using the R-based Jamovi software.
Results
Executing methodological step 7 in Fig. 2 resulted in the validation of the DET-Vis 10-item instrument presented in the Appendix. Analysis of the 212 responses to the test instrument generated a median score of 7.50 (SD = 2.44). The median time taken to complete the test was 10.3 min, which fits the recommendation for optimal online multiple-choice tests (e.g., Adams and Wieman 2011).
As suggested by Henson and Roberts (2006) and Knekta et al. (2019), the number of factors to retain were determined using multiple criteria that included Scree plot, parallel analysis and Velicer’s minimum average partial test. The scree plot (Fig. 5, continuous line) revealed a marked break after the first component, implying a one-factor solution. This was further supported by parallel analysis, wherein the eigenvalues for the data are compared to synthetic eigenvalues for random data of corresponding size (Fig. 5, dashed line). In contrast, Velicer’s minimum average partial test (Velicer et al. 2000) indicated that two factors should be retained. However, given that all items loaded heavily onto the first factor, while items loaded onto the second factor with lower values and in a pattern that did not offer any consistent interpretation, we decided to retain only the first factor. Thus, the analyses indicated that the data are consistent with one single latent variable. High communality values (> 0.7 for all but one item, see Table 1) indicate that the variance in the data is well accounted for by the resulting factor structure. The extracted factor explained 43.6% of the variance. All items loaded onto this variable with factor loadings larger than 0.4 as shown in Table 1.

Scree plot showing eigenvalues for the 10 extracted components (solid line). A marked break after the first component suggests a one-factor solution (“Scree test”). Parallel analysis where eigenvalues for the data are compared to synthetic eigenvalues for random data of corresponding size (dashed line) also support retaining one component
Psychometric properties of the DET-Vis are compiled in Table 1. The item difficulty index (i.e., the fraction of students who answered the item correctly) ranged between 0.56 to 0.81, which indicates that the test has an overall moderate difficulty. Corrected item-total correlations were used as the item discrimination coefficient (i.e., how well an item discerns between high and low performing students) and ranged between 0.25 and 0.53, with an average of 0.40. Values for item discrimination are typically considered to be acceptable if they are 0.2 or higher, and very good if they are 0.4 or higher (e.g., DiBattista and Kurzawa 2011; Grieger et al. 2022).
Discrimination coefficients were above 0.30 for all items except for item 4 and 10 which were close to 0.25. Furthermore, Cronbach’s alpha values with an item deleted does not indicate any poorly performing items. Taken together, the results indicate that the 10-item set exhibits acceptable psychometric properties, and measures a single dimension of knowledge about deep evolutionary time with adequate reliability (Cronbach’s alpha = 0.734) (e.g., Ursachi et al. 2015).
Discussion and implications
Our aim with this study was to develop an instrument for evaluating students’ knowledge in relation to interpretation and understanding of visual representations of DET. A seven-step method yielded a unidimensional, valid, and reliable ten-item deep evolutionary time visual test instrument (DET-Vis). DET-Vis contributes a diagnostic tool to the evolution education literature for measuring upper secondary school and undergraduate students’ knowledge in relation to interpreting and understanding the visual communication of deep evolutionary time. In doing so, development and validation of DET-Vis contributes to Furrow and Hsu's (2019) call for new assessments on previously unexplored aspects in evolution. Overall, the analysis and results indicate that the test instrument is unidimensional and of moderate difficulty. We suggest that the underlying and latent factor measured can be defined as “knowledge of visual representations of deep evolutionary time”.
Potential aspects of knowledge required to respond to DET-Vis
The DET-Vis items cover various aspects of DET that include recognizing order of events, discerning concurrency of events, and estimating and comparing time intervals (cf. Aigner et al. 2007; Stenlund and Tibell 2019). In this section we discuss, in turn, which of these time aspects the items may require knowledge about to answer. We also discuss whether aspects such as understanding of depicted biological relatedness or organism abundance were necessary, and the extent of potential declarative and procedural knowledge needed. Furthermore, we interpret the results in consideration of the revealed difficulty index and item discrimination in light of these cognitive requirements.
All items require participants to locate different temporal events regardless of whether the task requires ability to identify correct order of events, ability to observe their co-occurrence or making estimates about intervals. The items that focus on temporal order are 1, 3, 5, 7, 8 and 10 (Appendix), which all accompany phylogenetic trees requiring the respondent to engage declarative knowledge about the visual conventions used to portray the directionality of time (i.e., the order of events). Responding to items 1, 3 and 7 exclusively requires declarative knowledge about the visual convention that the root of a phylogram represents the most distant past and the branches lead to the more recent past. These three items all had high difficulty indices (i.e., were fairly “easy” to respond to) as well as high discrimination coefficients. Items 5 and 10 differ from items 1, 3 and 7 in that they also require knowledge about conventions for visually depicting relationships. Elements of procedural knowledge (i.e., comparing the intersecting points of several lineages) are also necessary to solve items 5 and 10. Despite their apparent supplementary cognitive demands, the difficulty index for these items emerged as 0.79 and 0.73, respectively. Nevertheless, they still discriminate adequately, which is a favorable criterion for moderately difficult items (Grieger et al. 2022; McGahee and Ball 2009). In contrast, item 8 proved to be the most difficult item of the instrument. Not only does it require declarative knowledge about order of events, but also procedural knowledge to mentally compare and judge the branching pattern of four phylograms to identify which two are similar and to understand that identical branching patterns represent the same relationship (Baum et al. 2005; Halverson et al. 2011). Despite the items above showing moderate difficulty indices, their high discrimination coefficients serve to strengthen their suitability as tools for diagnosing knowledge about the visual communication of DET.
Three items (2, 6 and 9) of the instrument focus on understanding temporal aspects of visualizing concurrency. They all likely require procedural knowledge (ability to find and compare temporal locations to deduce an answer) in parallel with a degree of declarative knowledge (e.g., understanding that rectangular bars positioned at the same "level" in the diagram represent concurrency). All three diagrams associated with the items have a vertical time axis and communicate occurrences of organisms, and in addition, item 2 includes information regarding abundance. All three items had good discrimination values (Grieger et al. 2022; McGahee and Ball 2009), which make them useful for measuring knowledge needed to perceive concurrent events.
Item 4 of DET-Vis involved estimations and comparisons of time intervals. It is the second most challenging item (difficulty index = 0.59) and needs students to map time intervals onto the visual of an outstretched human arm. To correctly deduce the correct alternative, students need to perform an arithmetical procedure to deduce the intervals that then have to be transformed to a spatial distance mapped onto the arm. Notwithstanding the second lowest difficulty index of the instrument, item 4 also displays a high discrimination value (0.58), thus providing information about the ability to compare time intervals.
The above description on the potential influence of aspects of knowledge in responding to DET-Vis supports the earlier described viewpoint of ten Berge and van Hezewijk (1999). Here, we regard the distinction between declarative knowledge (knowledge about visual conventions) and procedural knowledge (knowledge about how to apply conventions) as non-dichotomous, but rather intertwined and overlapping. In this light, the items might rather be thought of as existing on a continuum that draws on components of both procedural and declarative knowledge during problem solving.
Limitations
Although conducting the study has yielded a reliable and valid instrument around a unidimensional construct, there are three potential limitations. Firstly, 69% of respondents in the validation phase were either interested or very interested in evolutionary time. This might have constituted a potential bias toward more respondents being exposed to the visual communication of DET and in turn, a slightly inflated difficulty index. Despite this possibility, the average item discrimination coefficient of 0.40 indicates a good discriminatory power of the instrument (DiBattista and Kurzawa 2011; Grieger et al. 2022), a favorable characteristic for diagnostic tools in science education (e.g., Preece and Baxter 2000).
Secondly, the test was validated in Swedish educational settings at upper secondary and undergraduate levels. Further work may thus be needed to extend the validation to wider educational contexts in terms of age, nationality, and educational levels, as well as larger sample sizes. Albeit so, the validation was performed across a variety of educational settings (e.g., science programs, social science programs, and preschool and compulsory teacher training programs).
Thirdly, the scientific basis and visual communication of DET is the topic in focus in this paper. As Darwin (1859) already acknowledged, DET is a fundamental prerequisite for the theory of evolution. For this reason, any ontologically different world view that rejects the scientific estimates of the age of the earth and the origin of life would constitute a limitation that could skew responses to erroneous times. According to Heddy and Nadelson (2012) religiosity, school-life expectancy, science literacy, and GDP per capita are factors strongly correlated to public acceptance of evolution. It is less likely that these factors have influenced the validation of this test in a Swedish context, but implementation of the test in other contexts could potentially render the influence of factors such as world views opposed to the scientific view.
Considerations for classroom practice and future work
Apart from serving as a diagnostic tool, the instrument can be applied for pedagogical use in classroom practice. For example, the test could be used to establish a knowledge baseline prior to (and/or following) classroom teaching of evolutionary time, or related evolutionary concepts. In this way, it could also be employed as an accompaniment to summative assessment strategies. Furthermore, it could contribute to formative approaches (e.g., Adams and Wieman 2010) for improving understanding of the construct (e.g., Lee et al. 2011), through class discussion of individual or selected test items, as well as the nature and characteristics of visually communicating DET in relation to evolutionary knowledge. Such endeavors could also be carried out in conjunction with discussing other visual forms of DET (e.g., Fig. 1). Apart from a DET context that often includes tree representations to communicate the common ancestry of life, exposing students to visual representations such as tectonic plate movement and mineral and rock forming processes over geologic time might also allow them to conceptualize deep time in other contexts.
DET-Vis is a reliable and valid tool to measure a unidimensional construct, and there is an indication that both declarative and procedural knowledge structures are inherent in the construct of students’ knowledge of the visual communication of DET. Future work could be directed toward attempts to quantify to what extent each of these aspects might be diagnosed in further test development around DET. In line with the way students are typically exposed to visual representations of DET, static visual representations were used in the construction of DET-Vis. Further work could also consider how test items might be designed and validated to diagnose students’ interpretation and understanding of emerging dynamic and interactive visualizations of DET, where the student has to connect dynamically visualized trees and DET (e.g., Stenlund et al. 2021).
Appendix: Deep evolutionary time visual instrument (DET-Vis)
-
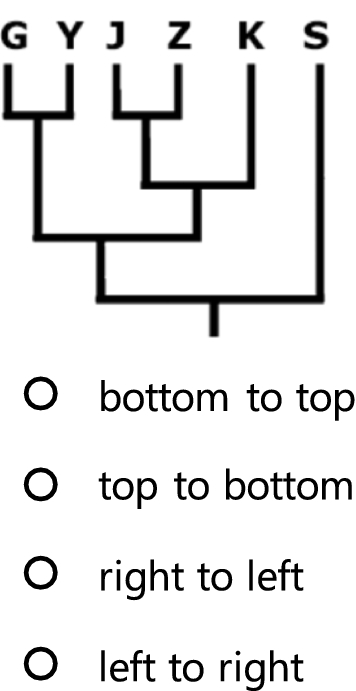
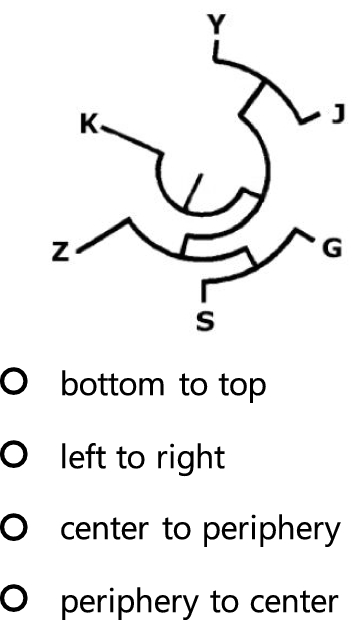
1.
The displayed tree of life shows six different species (represented by letters). In which direction is the passage of time?
-
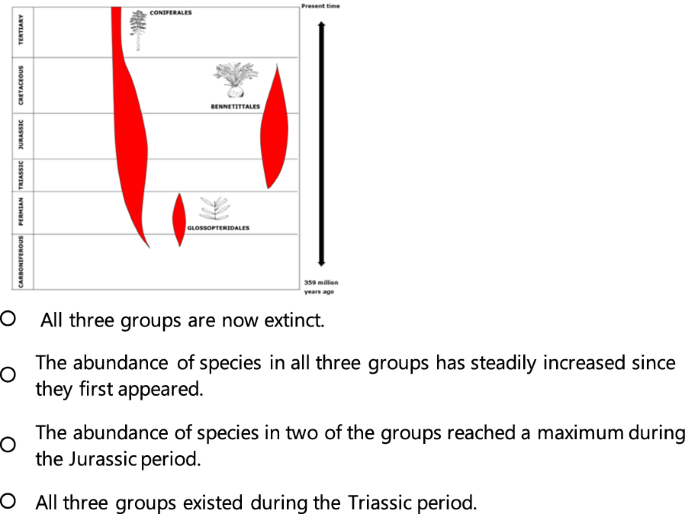
2.
The diagram shows the abundance of species in three plant groups during six geologic periods. Which statement is best supported by the diagram?
-
3.
The displayed tree of life shows six different species (represented by letters). In which direction is the passage of time?
-
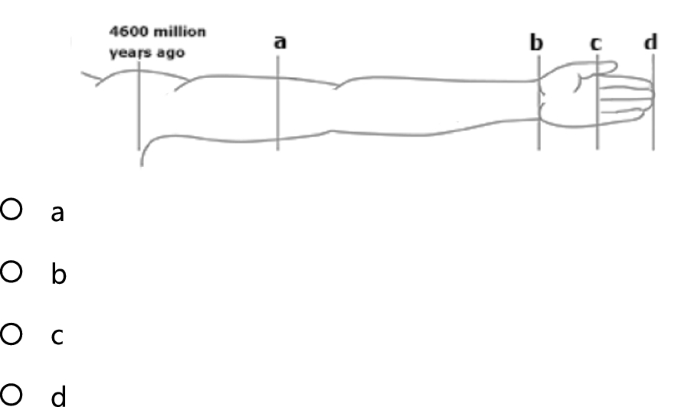
4.
If the shoulder represents the formation of earth (4600 million years ago) and the tip of the middle finger represents present time, which position (a, b, c or d) represents when fish first appeared 500 million years ago?
-
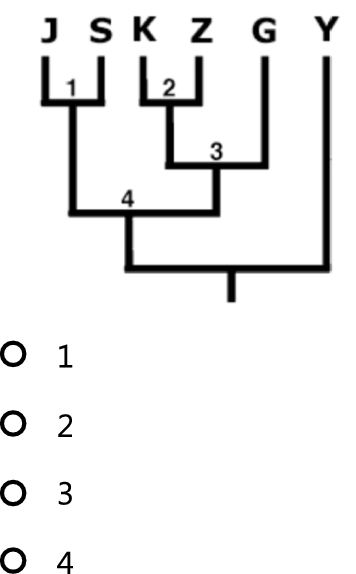
5.
Which of the points (1, 2, 3 or 4) in the diagram indicates the most recent common ancestor of species S and Z?
-
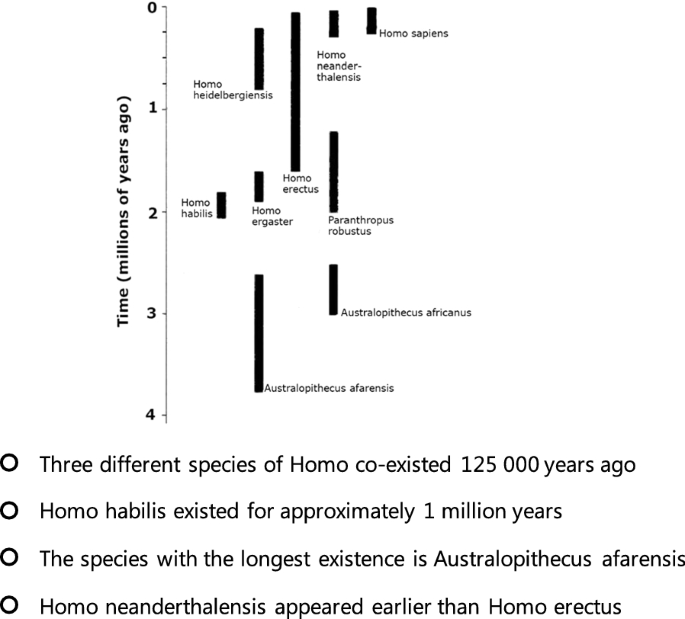
6.
The diagram shows the occurrence of different species during human evolution. Which statement is correct?
-
7.
The displayed tree of life shows six different species (represented by letters). In which direction is the passage of time?
-
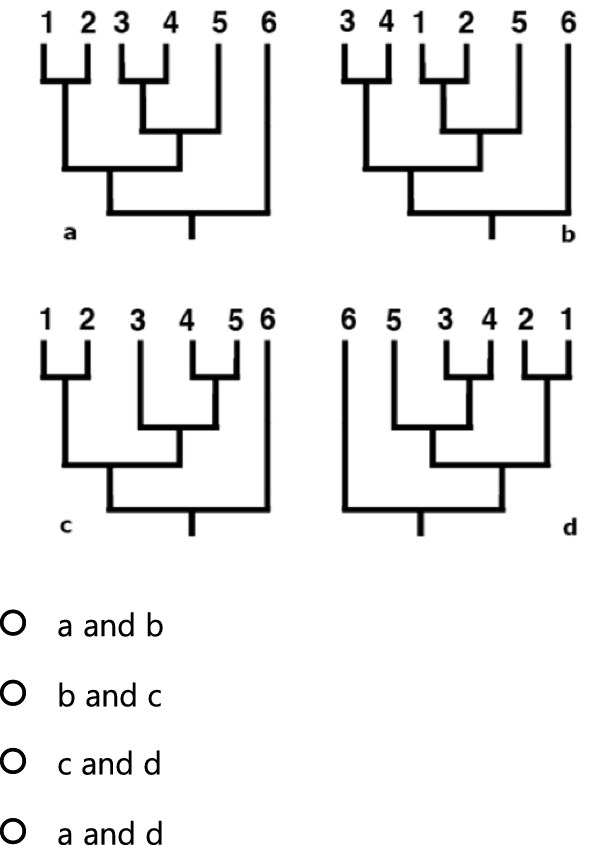
8.
Each of the following trees shows six different species (1–6). Which two trees depict identical relationships?
-
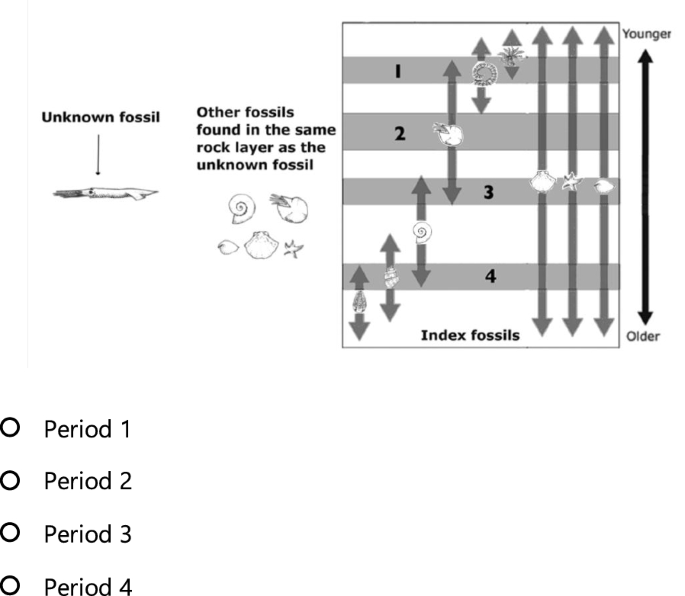
9.
Fossils can be dated by comparing other fossils in the same rock layer which existed during known periods (index fossils). What period (1, 2, 3 or 4) does the unknown fossil belong to?
-
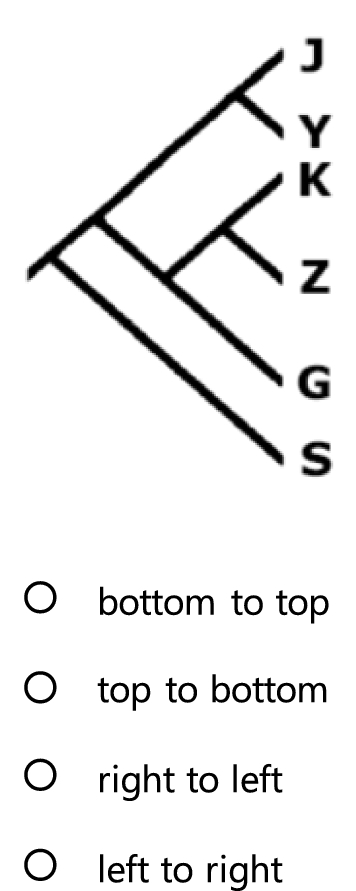
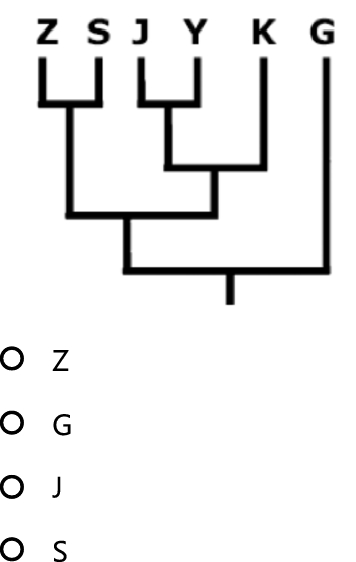
10.
The species represented by the letters are related. Which of the following species is most closely related to species K?


Correct responses
-
1.
Alternative 1
-
2.
Alternative 3
-
3.
Alternative 4
-
4.
Alternative 3
-
5.
Alternative 4
-
6.
Alternative 1
-
7.
Alternative 3
-
8.
Alternative 4
-
9.
Alternative 3
-
10.
Alternative 3
Availability of data and materials
All analyzed data is available through contact with the corresponding author.
Abbreviations
- DET:
-
Deep evolutionary time
- DET-Vis:
-
Deep evolutionary time visual instrument
References
Adams WK, Wieman CE. Development and validation of instruments to measure learning of expert-like thinking. Int J Sci Educ. 2010;24:1289–312.
Adams WK, Wieman CE. Development and validation of instruments to measure learning of expert-like thinking. Int J Sci Educ. 2011;33(9):1289–312.
Aigner W, Miksch S, Müller W, Schumann H, Tominski C. Visualizing time-oriented data—a systematic view. Comput Graph. 2007;31(3):401–9.
Anderson DL, Fisher KM, Norman GJ. Development and evaluation of the conceptual inventory of natural selection. J Res Sci Teach. 2002;39(10):952–78.
Barnosky AD, Matzke N, Tomiya S, Wogan GOU, Swartz B, Quental TB, et al. Has the Earth’s sixth mass extinction already arrived? Nature. 2011;471(7336):51–7.
Baum DA, Smith SD, Donovan SSS. The tree-thinking challenge. Science. 2005;310(5750):979.
Benson J, Clark F. A guide for instrument development and validation. Am J Occup Ther. 1982;36(12):789–800.
Bjornerud M. Timefulness : how thinking like a geologist can help save the world. Princeton, NJ: Princeton University Press; 2018.
Blacquiere LD, Hoese WJ. A valid assessment of students’ skill in determining relationships on evolutionary trees. Evo Edu Outreach. 2016;9(1):5.
Blacquiere LD, Fawaz A, Hoese WJ. Who’s related to whom? Use published phylogenies and make customized tree-thinking assessments. Evo Edu Outreach. 2020;13(1):20.
Briggs SR, Cheek JM. The role of factor analysis in the development and evaluation of personality scales. J Personal. 1986;54(1):106.
Buonomano D. Your brain is a time machine : the neuroscience and physics of time. New York: W. W. Norton & Company; 2017.
Carroll SB. The making of the fittest : DNA and the ultimate forensic record of evolution [Internet]. New York: Norton; 2006. http://www.loc.gov/catdir/toc/ecip0614/2006017197.html
Catley KM, Novick LR. Seeing the wood for the trees: an analysis of evolutionary diagrams in biology textbooks. Bioscience. 2008;58(10):976–87.
Catley KM, Novick LR. Digging deep: exploring college students’ knowledge of macroevolutionary time. J Res Sci Teach. 2009;46(3):311–32.
Ceballos G, Ehrlich PR, Barnosky AD, García A, Pringle RM, Palmer TM. Accelerated modern human–induced species losses: entering the sixth mass extinction. Sci Adv. 2015. https://doi.org/10.1126/sciadv.1400253.
Cheek KA. Factors underlying students’ conceptions of deep time: an exploratory study [Internet]. Durham University; 2010 [cited 2015 Oct 8]. http://etheses.dur.ac.uk/277/
Cheek KA, LaDue ND, Shipley TF. Learning about spatial and temporal scale: current research, psychological processes, and classroom implications. J Geosci Educ. 2017;65(4):455–72.
Cobern WW. Worldview theory and conceptual change in science education. Sci Educ. 1996;80(5):579–610.
Colantonio A, Testa I, Leccia S, Marzoli I. Students’ understanding of Universe birth and evolution. Il Nuovo Cimento c. 2021;44(405):1–4.
Conceição SCO, Strachota E, Schmidt SW. The development and validation of an instrument to evaluate online training materials. Online submission. 2007;7.
Darwin C. On the origin of species by means of natural selection : or the preservation of favoured races in the struggle for life. London: John Murray; 1859.
Dees J, Momsen JL. Student construction of phylogenetic trees in an introductory biology course. Evol Educ Outreach. 2016;9(1):3.
DiBattista D, Kurzawa L. Examination of the quality of multiple-choice items on classroom tests. cjsotl-rcacea [Internet]. 2011 [cited 2022 Feb 25];2(2). https://ojs.lib.uwo.ca/index.php/cjsotl_rcacea/article/view/6902
Dodick J, Orion N. Cognitive factors affecting student understanding of geologic time. J Res Sci Teach. 2003;40(4):415–42.
Dodick J, Orion N. Measuring student understanding of geological time. Sci Educ. 2003;87(5):708–31.
Estrup EJ, Achiam M. The potential of palaeontology for science education. Nordic Stud Sci Educ. 2019;15(1):97–108.
Field AP. Discovering statistics using IBM SPSS statistics. 5th ed. London: Sage Publications; 2018.
Furrow RE, Hsu JL. Concept inventories as a resource for teaching evolution. Evol Educ Outreach. 2019;12(1):2.
Gregory TR. Understanding evolutionary trees. Evol Educ Outreach. 2008;1(2):121–37.
Grieger K, Schiro A, Leontyev A. Development of the assessment of student knowledge of green chemistry principles (ASK-GCP). Chem Educ Res Pract. 2022. https://doi.org/10.1039/D1RP00291K.
Halverson KL, Friedrichsen P. Learning tree thinking: developing a new framework of representational competence. In: Treagust DF, Tsui C-Y, editors. Multiple representations in biological education. Dordrecht: Springer Netherlands; 2013. p. 185–201. https://doi.org/10.1007/978-94-007-4192-8_11.
Halverson KL, Pires CJ, Abell SK. Exploring the complexity of tree thinking expertise in an undergraduate systematics course: complexity of tree thinking expertise. Sci Ed. 2011;95(5):794–823.
Hansson L, Redfors A. Swedish upper secondary students’ views of the origin and development of the universe. Res Sci Educ. 2006;36(4):355–79.
Heddy BC, Nadelson LS. A global perspective of the variables associated with acceptance of evolution. Evol Educ Outreach. 2012;5(3):412–8.
Henson RK, Roberts JK. Use of exploratory factor analysis in published research: common errors and some comment on improved practice. Educ Psychol Measur. 2006;66(3):393–416.
Hidalgo AJ, Fernando IESS, Otero ICEJ. REEARCH REPORT: an analysis of the understanding of geological time by students at secondary and post-secondary level. Int J Sci Educ. 2004;26(7):845–57.
Hoekstra HE, Krenz JG, Nachman MW. Local adaptation in the rock pocket mouse (Chaetodipus intermedius): natural selection and phylogenetic history of populations. Heredity. 2005;94(2):217–28.
Irvine R. Deep time: an anthropological problem. Soc Anthropol/anthropologie Sociale. 2014;22(2):157–72.
Johansson V, Stenlund J. Making time/breaking time: critical literacy and politics of time in data visualisation. J Document. 2022;78(1):60–82.
Knekta E, Runyon C, Eddy S. One size doesn’t fit all: using factor analysis to gather validity evidence when using surveys in your research. Brickman P, editor. LSE. 2019;18(1): rm1.
Lee H-S, Liu OL, Price CA, Kendall ALM. College students’ temporal-magnitude recognition ability associated with durations of scientific changes. J Res Sci Teach. 2011;48(3):317–35.
Libarkin JC, Brick C. Research methodologies in science education: visualization and the geosciences. J Geosci Educ. 2002;50(4):449–55.
Matuk C. Images of evolution. J Biocommun. 2007;33(3):8.
McGahee TW, Ball J. How to read and really use an item analysis. Nurse educator. LWW. 2009;34(4):166–71.
Meir E, Perry J, Herron JC, Kingsolver J. College students’ misconceptions about evolutionary trees. Am Biol Teach. 2007;69(7):e71–6.
Nadelson LS, Southerland SA. Development and preliminary evaluation of the measure of understanding of macroevolution: introducing the MUM. J Exp Educ. 2009;78(2):151–90.
Nehm RH, Mead LS. Evolution assessment: introduction to the special issue. Evol Educ Outreach. 2019. https://doi.org/10.1186/s12052-019-0098-x.
Novick LR, Catley KM. Assessing students’ understanding of macroevolution: concerns regarding the validity of the MUM. Int J Sci Educ. 2012;34(17):2679–703.
Odom AL, Kelly PV. Integrating concept mapping and the learning cycle to teach diffusion and osmosis concepts to high school biology students. Sci Educ. 2001;85(6):615–35.
Oliveira AW, Cook K. Student visual communication of evolution. Res Sci Educ. 2017;47(3):519–38.
Pearce BKD, Tupper AS, Pudritz RE, Higgs PG. Constraining the time interval for the origin of life on earth. Astrobiology. 2018;18(3):343–64.
Pearson RH, Mundform DJ. Recommended sample size for conducting exploratory factor analysis on dichotomous data. J Mod App Stat Meth. 2010;9(2):359–68.
Preece PFW, Baxter JH. Scepticism and gullibility: the superstitious and pseudo-scientific beliefs of secondary school students. Int J Sci Educ. 2000;22(11):1147–56.
Rubio DM, Berg-Weger M, Tebb SS, Lee ES, Rauch S. Objectifying content validity: conducting a content validity study in social work research. Soc Work Res. 2003;27(2):94–104.
Schönborn KJ, Bögeholz S. Knowledge transfer in biology and translation across external representations: experts’ views and challenges for learning. Int J Sci Math Educ. 2009;7(5):931–55.
Schramm T, Jose A, Schmiemann P. Seeing the woods for the trees again: analyzing evolutionary diagrams in German and US university-level textbooks. Educ Sci. 2021;11(8):367.
Stenlund J. Travelling through time: Students’ interpretation of evolutionary time in dynamic visualizations. Linköping: Linköping University Electronic Press; 2019. http://urn.kb.se/resolve?urn=urn:nbn:se:liu:diva-154619
Stenlund JI, Tibell LAE. Visualizing macroevolutionary timescales: students’ comprehension of different temporal representations in an animation. Evol Educ Outreach. 2019. https://doi.org/10.1186/s12052-019-0099-9.
Stenlund JI, Schönborn KJ, Tibell LAE. Zooming in time—exploring students’ interpretations of a dynamic tree of life. J Sci Educ Technol. 2021;30(1):125–38.
Subramanian M. Humans versus Earth: the quest to define the Anthropocene. Nature. 2019;572(7768):168–70.
Tabachnick BG, Fidell LS, Ullman JB. Using multivariate statistics. 7th ed. New York, NY: Pearson; 2019.
ten Berge T, van Hezewijk R. Procedural and declarative knowledge: an evolutionary perspective. Theory Psychol. 1999;9(5):605–24.
Thanukos A. Evolutionary trees from the tabloids and beyond. Evol Educ Outreach. 2010;3(4):563–72.
Trend R. An investigation into understanding of geological time among 10- and 11-year-old children. Int J Sci Educ. 1998;20(8):973–88.
Trend R. Conceptions of geological time among primary teacher trainees, with reference to their engagement with geoscience, history, and science. Int J Sci Educ. 2000;22(5):539–55.
Trend R. An investigation into the understanding of geological time among 17-year-old students, with implications for the subject matter knowledge of future teachers. Int Res Geogr Environ Educ. 2001;10(3):298–321.
Trend R. Deep time framework: a preliminary study of U.K. primary teachers’ conceptions of geological time and perceptions of geoscience. J Res Sci Teach. 2001;38(2):191–221.
Ursachi G, Horodnic IA, Zait A. How reliable are measurement scales? External factors with indirect influence on reliability estimators. Proc Econ Financ. 2015;20:679–86.
Velicer WF, Eaton CA, Fava JL. Construct explication through factor or component analysis: a review and evaluation of alternative procedures for determining the number of factors or components. In: Goffin RD, Helmes E, editors. Problems and solutions in human assessment. Boston, MA: Springer, US; 2000. p. 41–71.
Wood B. Reconstructing human evolution: Achievements, challenges, and opportunities. Proc Natl Acad Sci. 2010;107(Supplement_2):8902–9.
Acknowledgements
We thank the anonymous respondents for participating in the test development. All images in the DET-Vis were created by author JS, and the DET-Vis instrument is free to use, distribute and administer in accordance with the stipulations of the Creative Commons Attribution 4.0 International (CC BY 4.0) license.
Funding
Open access funding provided by Linköping University. The research was funded by the Swedish National School in Science and Technology Education Research (FontD) (Swedish Research Council grant number 729-2013-6871) and Örebro University.
Author information
Authors and Affiliations
Contributions
JS and KS conceptualized the idea for the study. JS managed the data collection and implementation. JS produced the item content, and KS and GH provided iterative feedback and discussion during item development. JS and GH performed the primary statistical analysis. JS outlined and penned the first draft of the manuscript. All authors participated in revising the manuscript and making modifications. All authors read and approved the final manuscript.
Corresponding author
Ethics declarations
Ethics declaration and consent to participate
Informed consent was obtained from all voluntary and anonymous respondents involved in the study. Potential respondents were informed about the objective of the survey collection, and described how data will be stored, secured and remain confidential with information provided on the starting screen of the survey questionnaire. Respondents provided consent to participate in the survey when they ticked the box beside the statement that read, “I agree”. The study did not include treatment of sensitive personal information, nor physical or other potentially harmful interventions, and therefore did not fall under the Swedish law (2003:460) on Ethical Review of Research Involving Humans.
Competing interests
The authors declare that they have no competing interests.
Additional information
Publisher's Note
Springer Nature remains neutral with regard to jurisdictional claims in published maps and institutional affiliations.
Rights and permissions
Open Access This article is licensed under a Creative Commons Attribution 4.0 International License, which permits use, sharing, adaptation, distribution and reproduction in any medium or format, as long as you give appropriate credit to the original author(s) and the source, provide a link to the Creative Commons licence, and indicate if changes were made. The images or other third party material in this article are included in the article's Creative Commons licence, unless indicated otherwise in a credit line to the material. If material is not included in the article's Creative Commons licence and your intended use is not permitted by statutory regulation or exceeds the permitted use, you will need to obtain permission directly from the copyright holder. To view a copy of this licence, visit http://creativecommons.org/licenses/by/4.0/. The Creative Commons Public Domain Dedication waiver (http://creativecommons.org/publicdomain/zero/1.0/) applies to the data made available in this article, unless otherwise stated in a credit line to the data.
About this article

Cite this article
Stenlund, J.I., Schönborn, K.J. & Höst, G.E. Design and validation of a deep evolutionary time visual instrument (DET-Vis). Evo Edu Outreach 15, 12 (2022). https://doi.org/10.1186/s12052-022-00170-6
Received:
Accepted:
Published:
DOI: https://doi.org/10.1186/s12052-022-00170-6